Algorithm description
The interferometric analysis algorithm is divided into two main stages, depending on the input product nature.
If interferogram data are provided, coherence must be computed (by setting to True the configuration variable
enable_coherence_computation) before evaluating the 2D intensity histograms. Otherwise, if the input product already
contains coherence values, this last operation can be directly performed.
Coherence Computation (Optional)
Each channel of the input product is separately analyzed and also if the product is not merged, i.e. it's still subdivided into bursts, this feature is preserved and data are processed burst by burst.
For each data portion to be processed, coherence is computed by performing a 2D convolution with a normalized rectangular Boxcar filter both on input complex data and on its magnitude and evaluating the ratio between the two.
2D Coherence Intensity Histograms
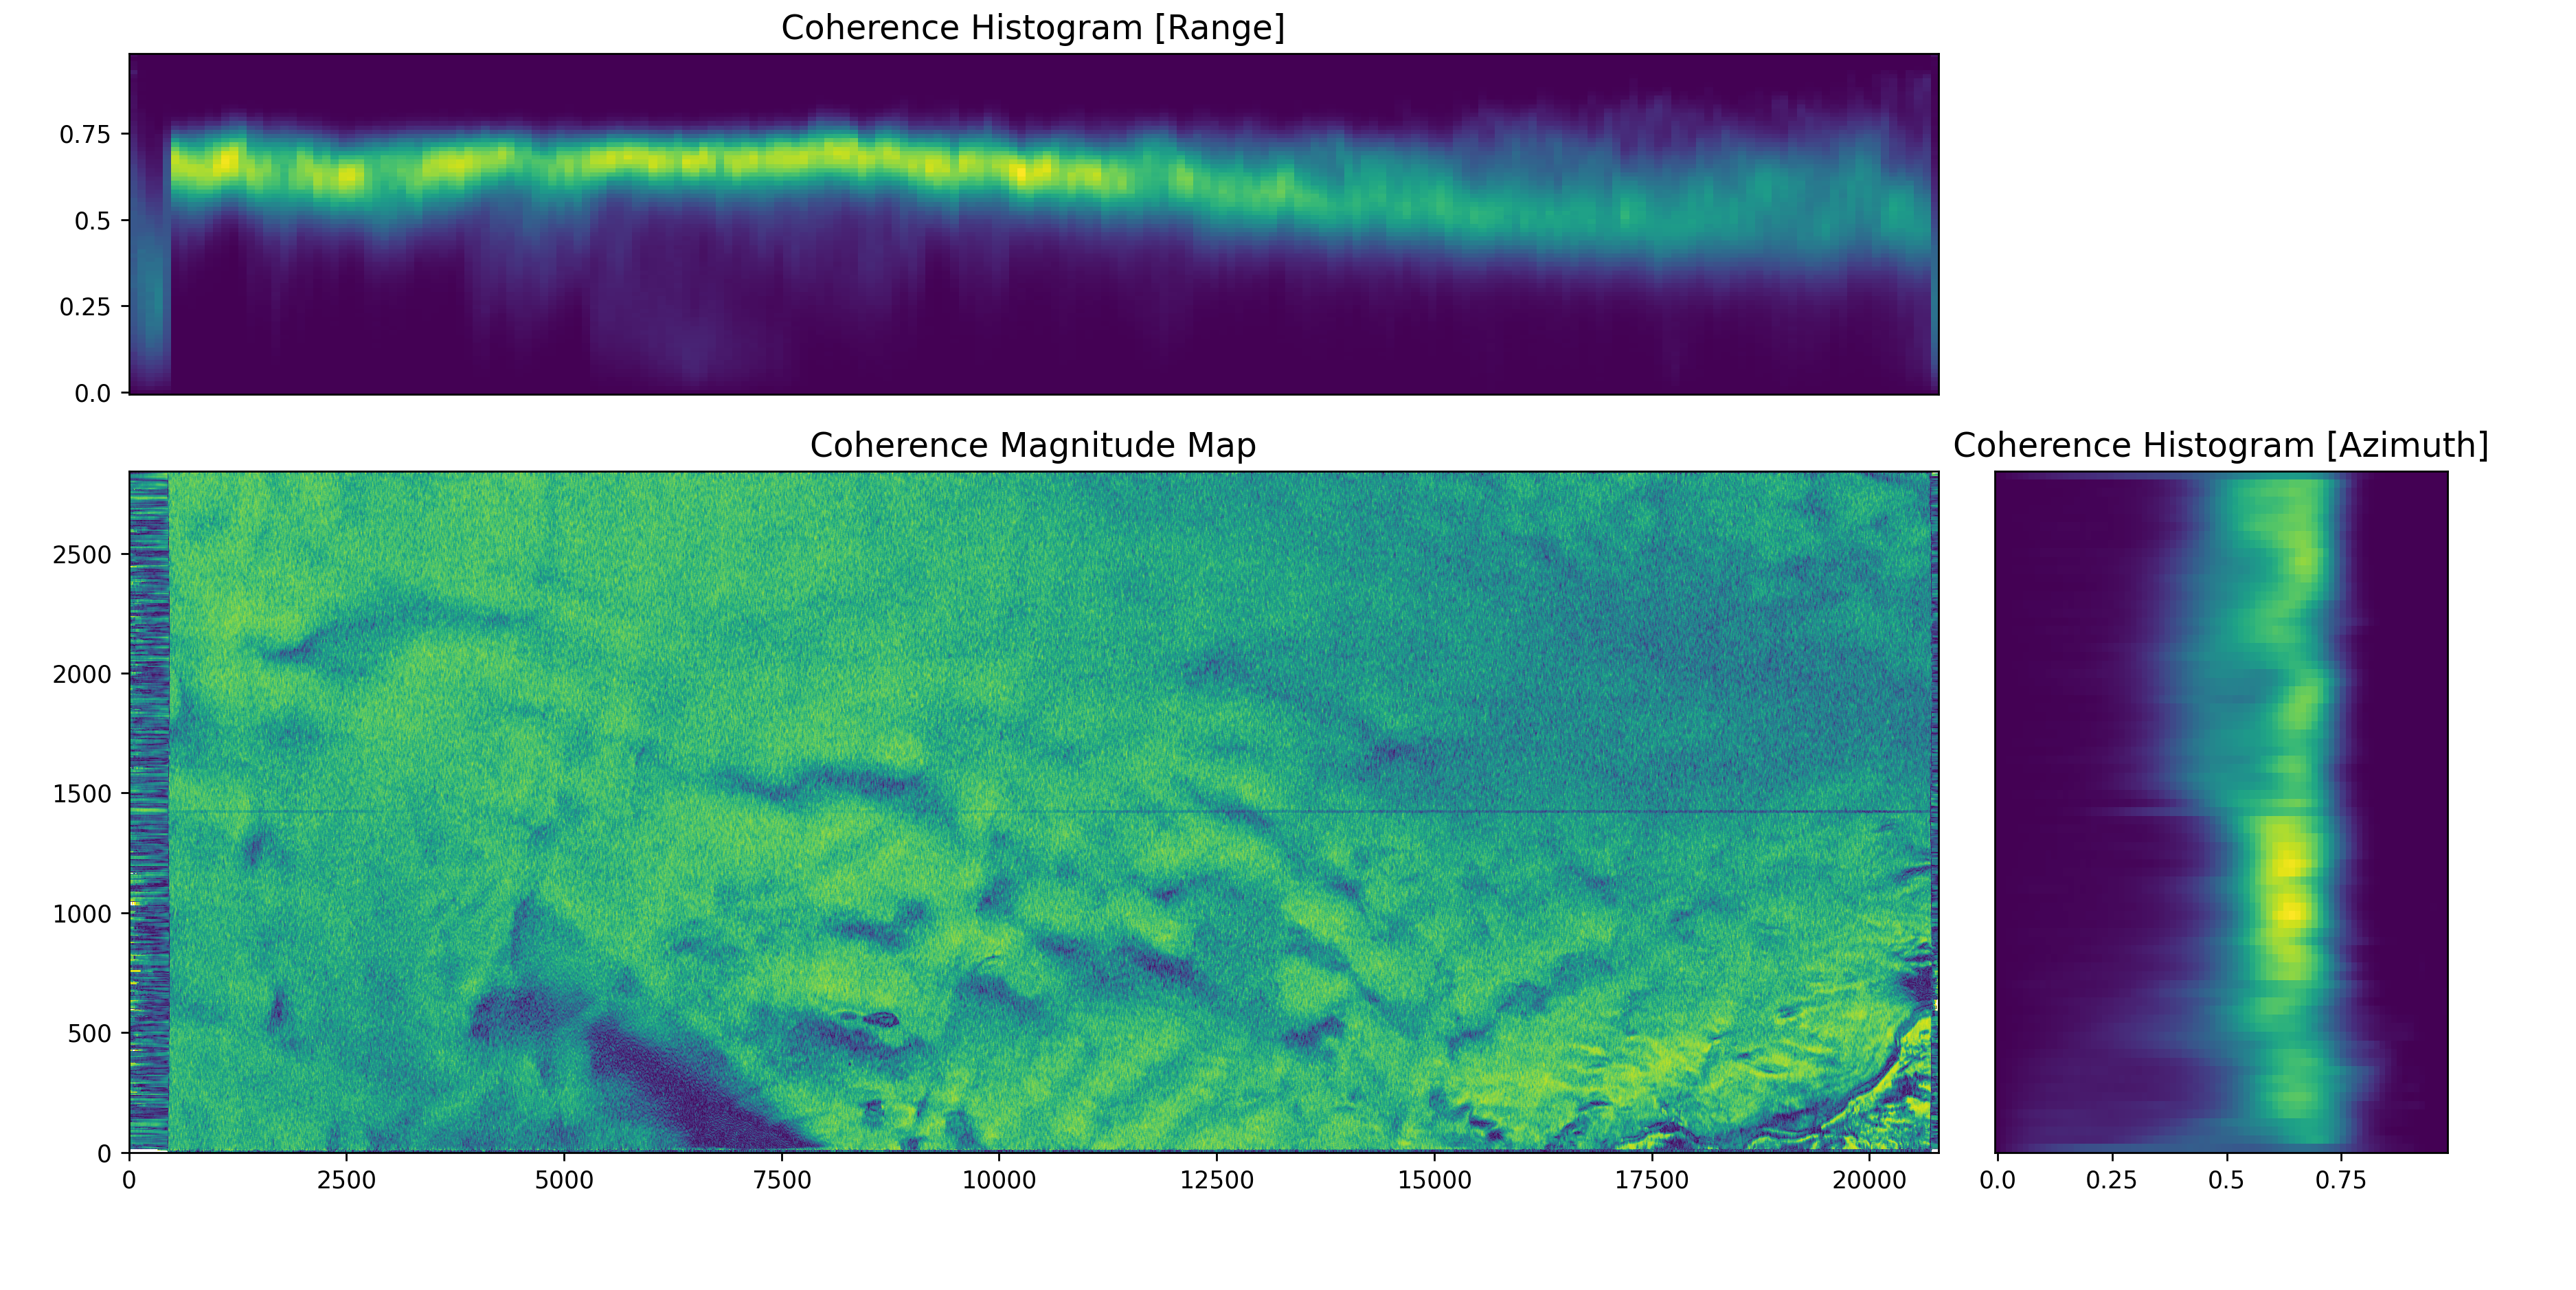
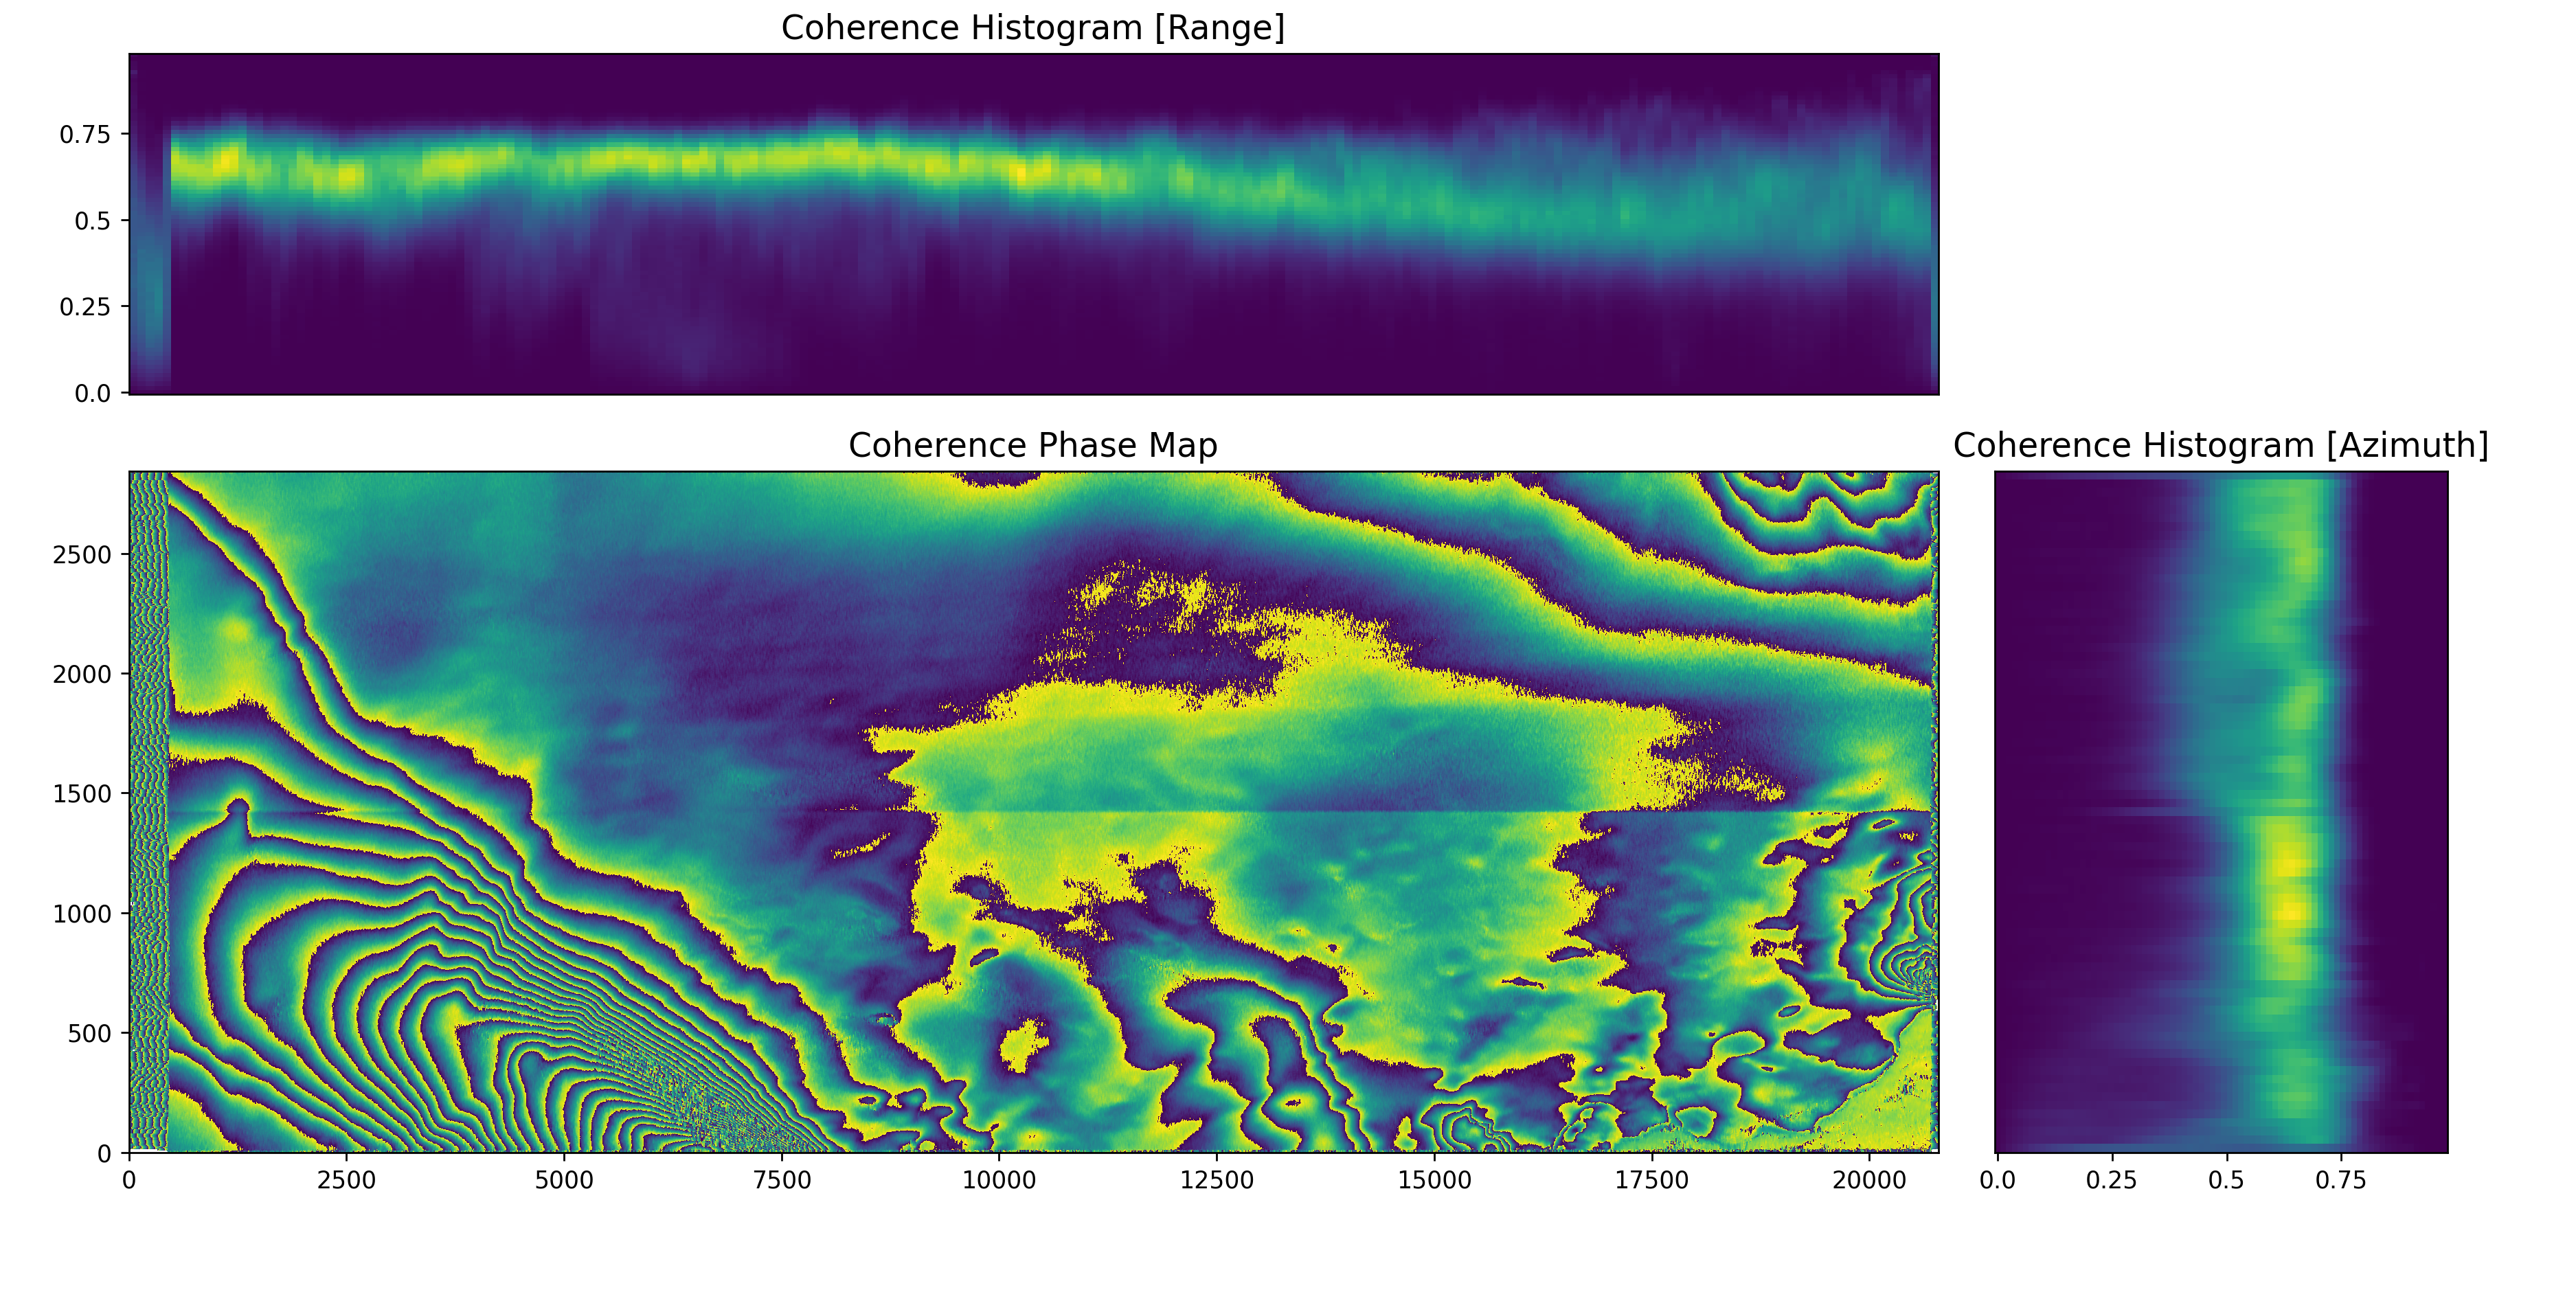
2D histograms to determine the distribution of coherence intensity in the scene are computed for each data portion after partitioning it in blocks along a given direction and determining the histogram on each of those blocks. This operation is performed along both SAR directions (range and azimuth) and saved as an NxM array with shape equal to the number of the number of coherence intensity bins and the number of partitioning block along that direction.
Analysis Output
Interferometric analysis output consists in a .nc NetCDF4 file containing the 2D coherence histograms computed along both
directions. Also, graphical plots can be obtained as output using the graphical_output.radiometric_2D_hist_plot
functionality showing the coherence map (amplitude and phase available) and the two histograms along the corresponding axes.
Graphical output
Graphical output functionalities are available only if the package has been installed with the [graphs] optional
dependencies.
Refer to the installation documentation for further information on how to install it.