Algorithm description
Spectral Analysis can be used to investigate the spectral content of a selected data region by extracting absolute and/or phase profiles in the frequency domain.
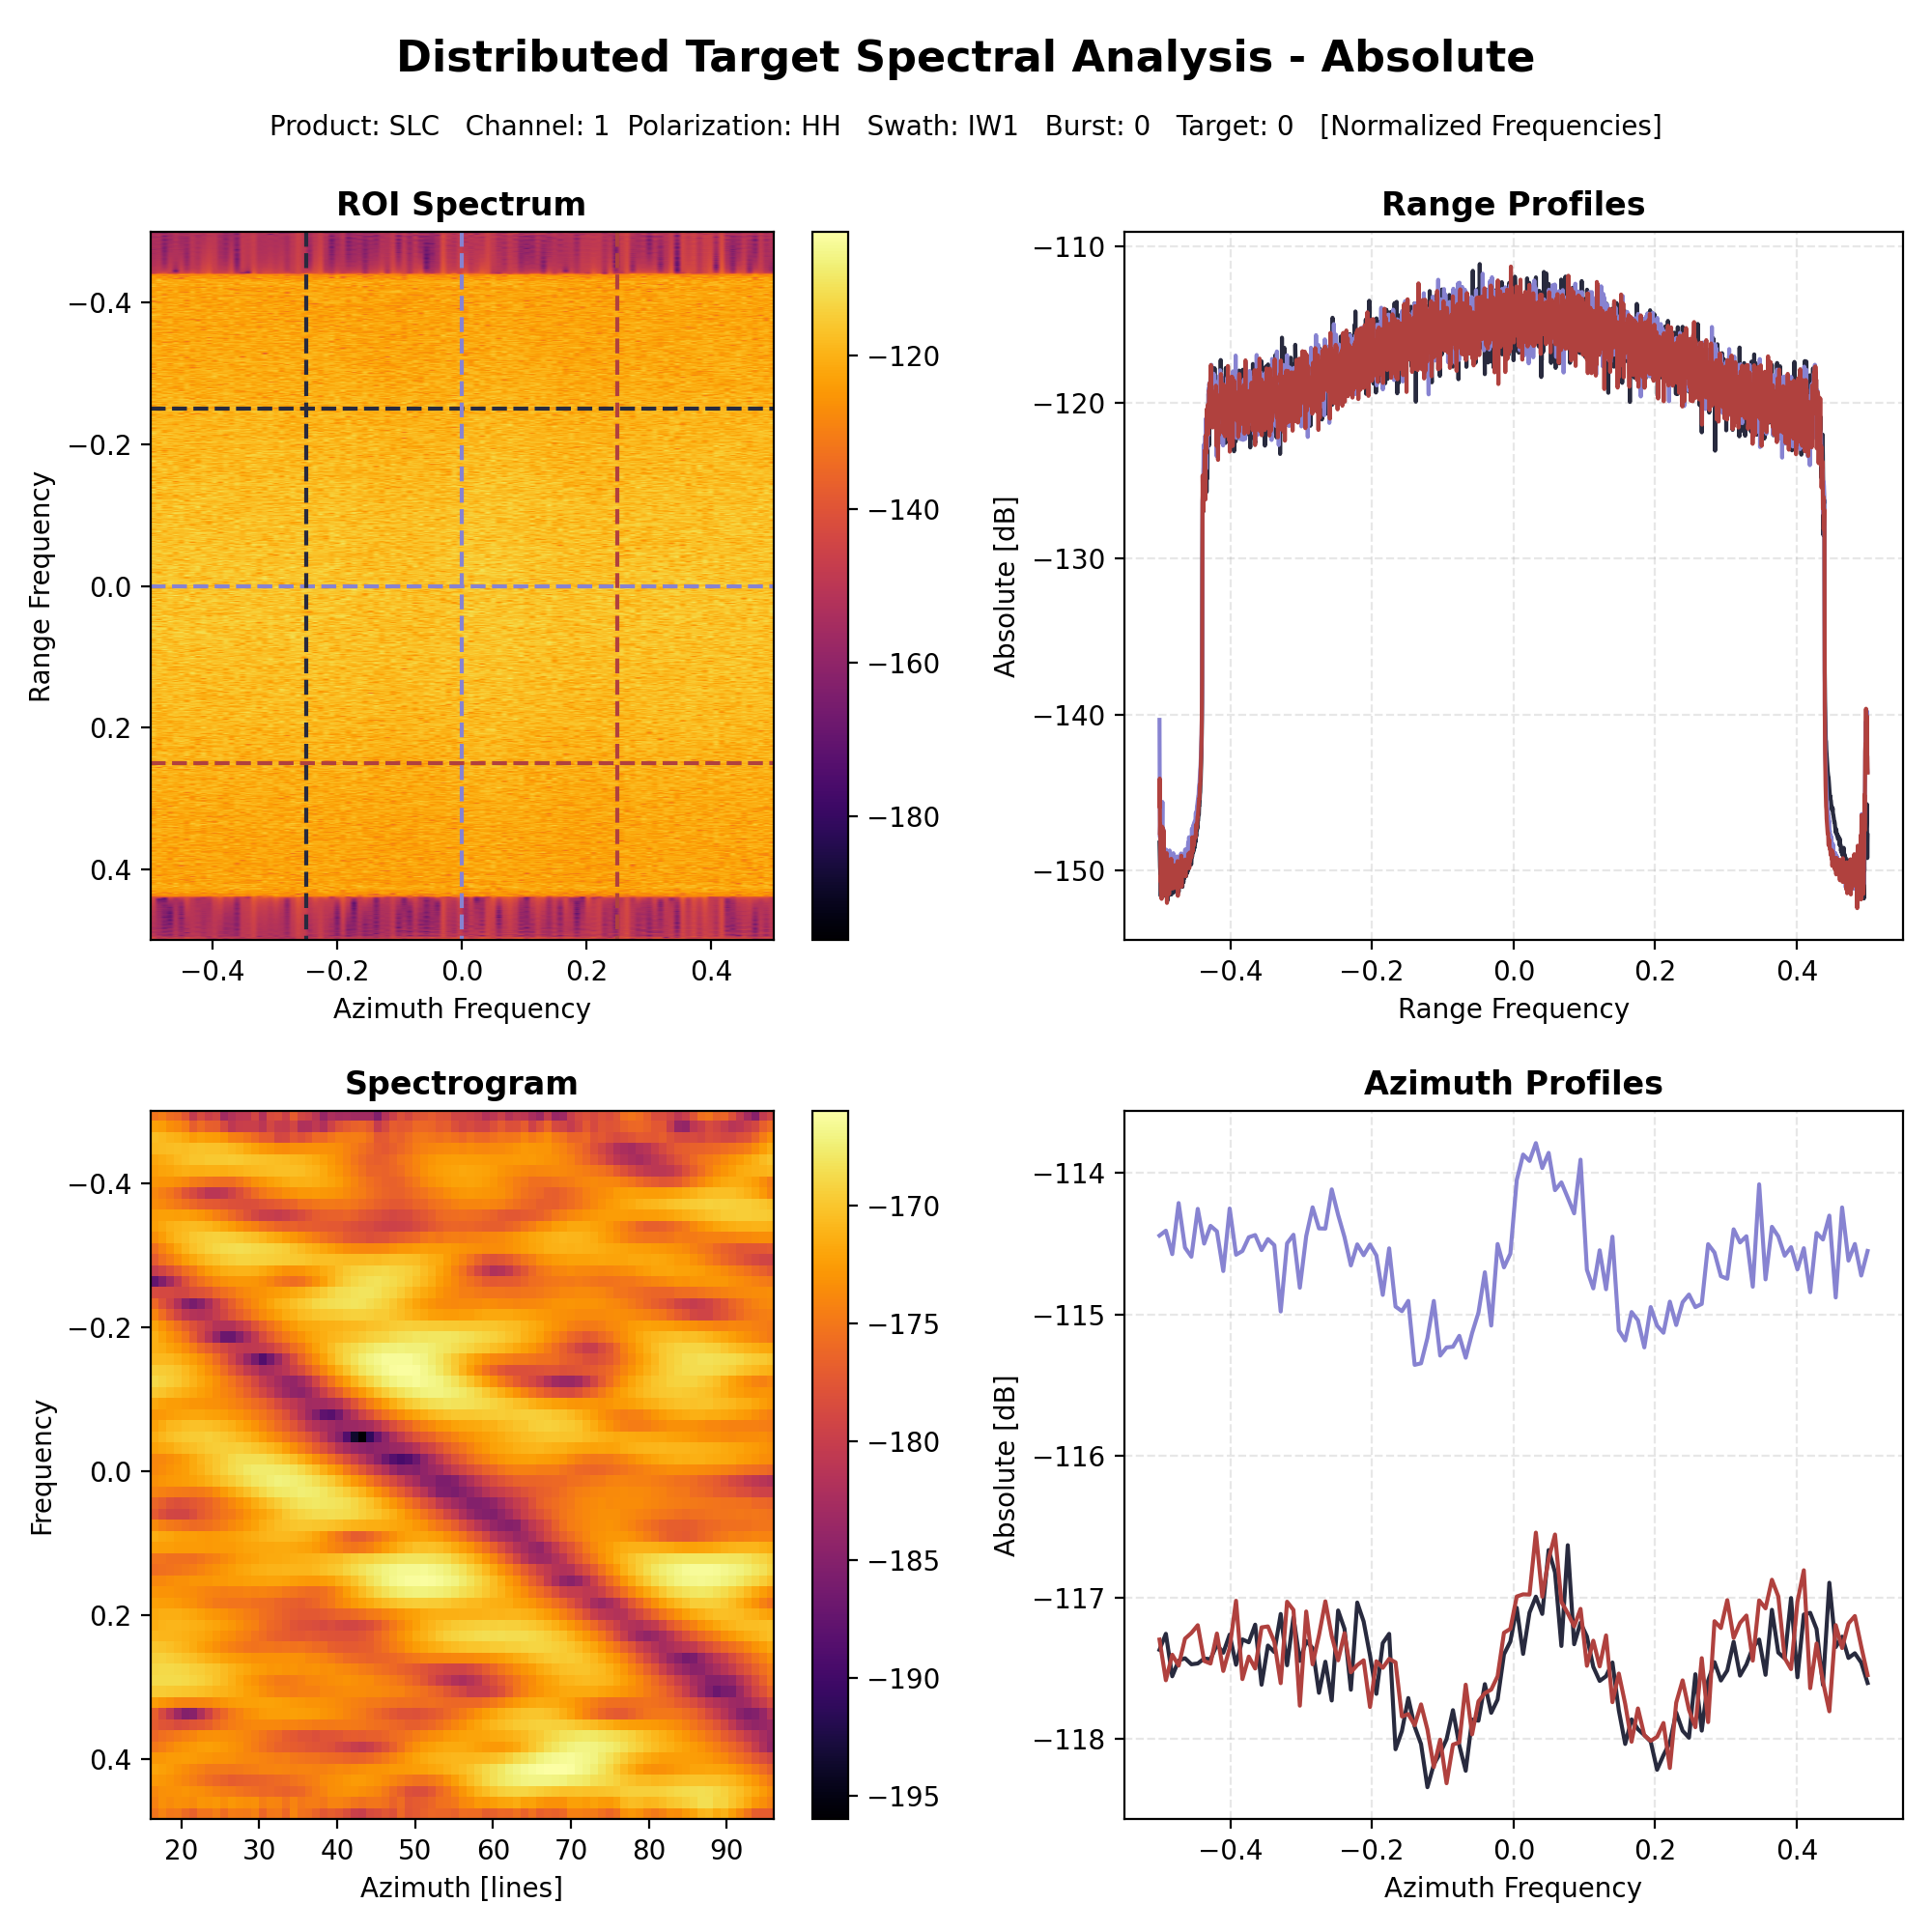
Distributed Target Spectral Analysis
Distributed targets can be investigated using this analysis by providing the pixel coordinates of one or more ROIs and the extent of the data portion to be read. This results in Absolute Spectral Analysis in dB consisting in a 4-tile chart displaying the fft of the ROI, the range and azimuth profiles and a spectrogram.
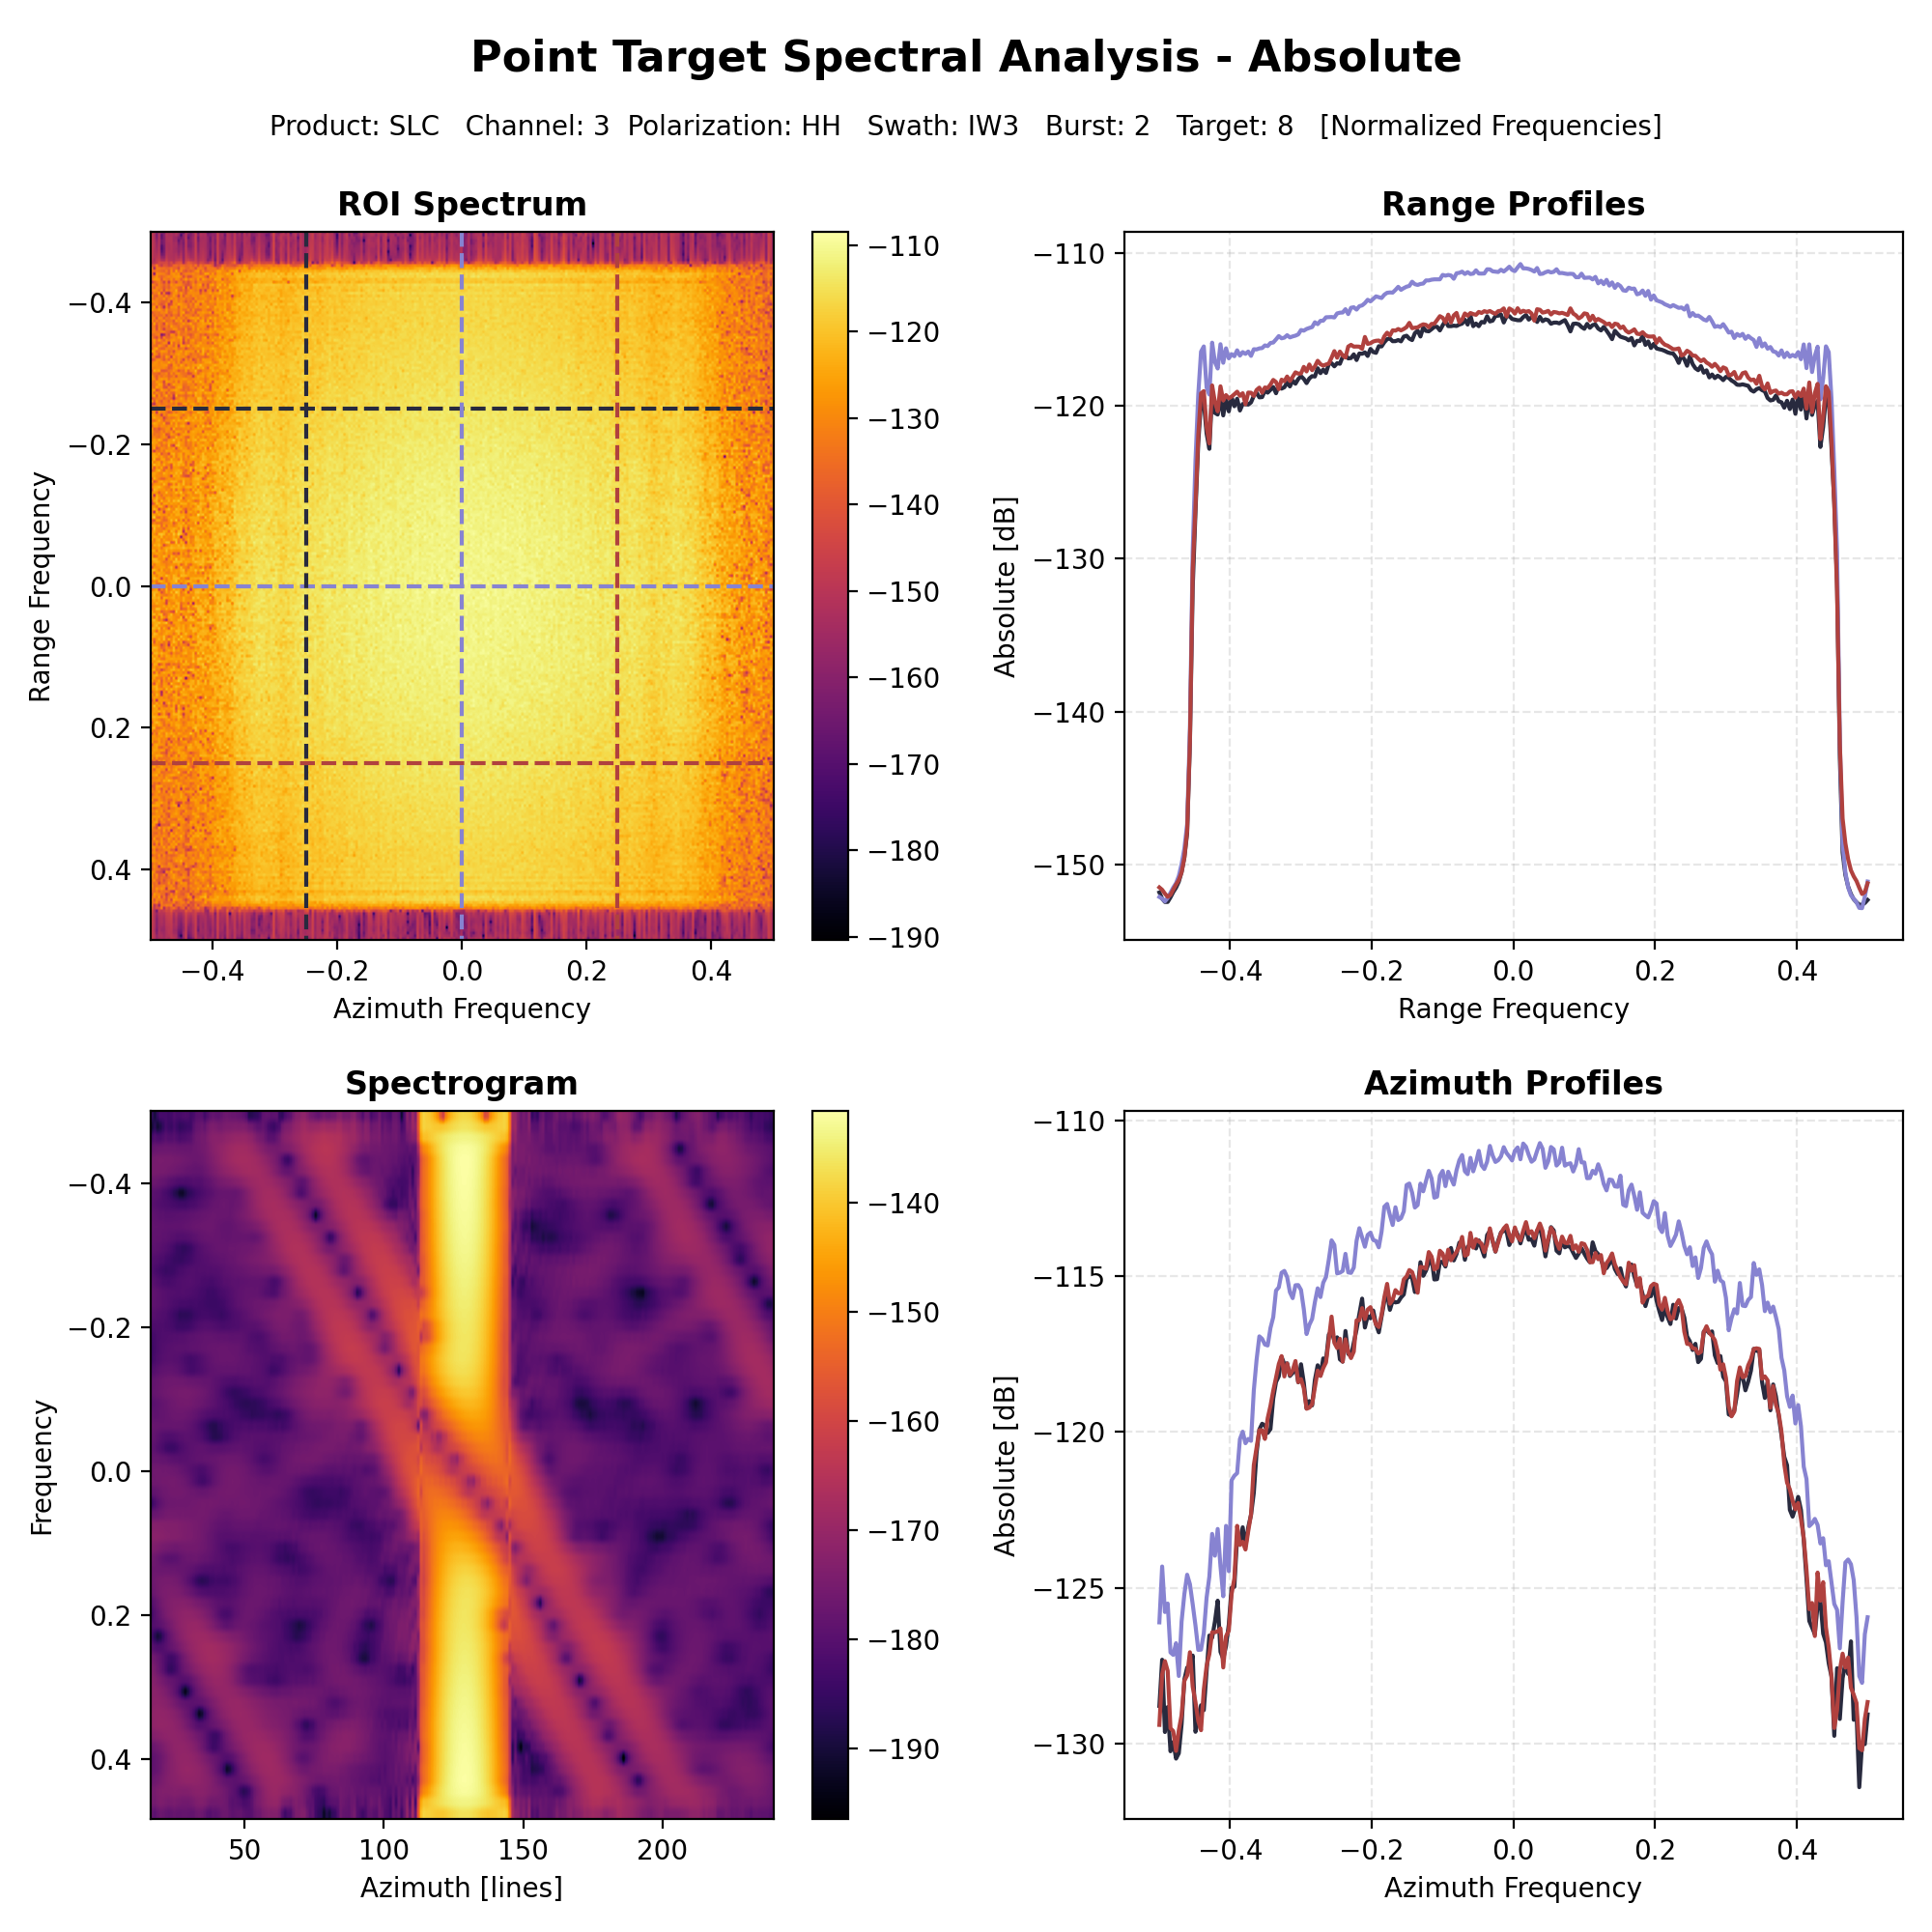
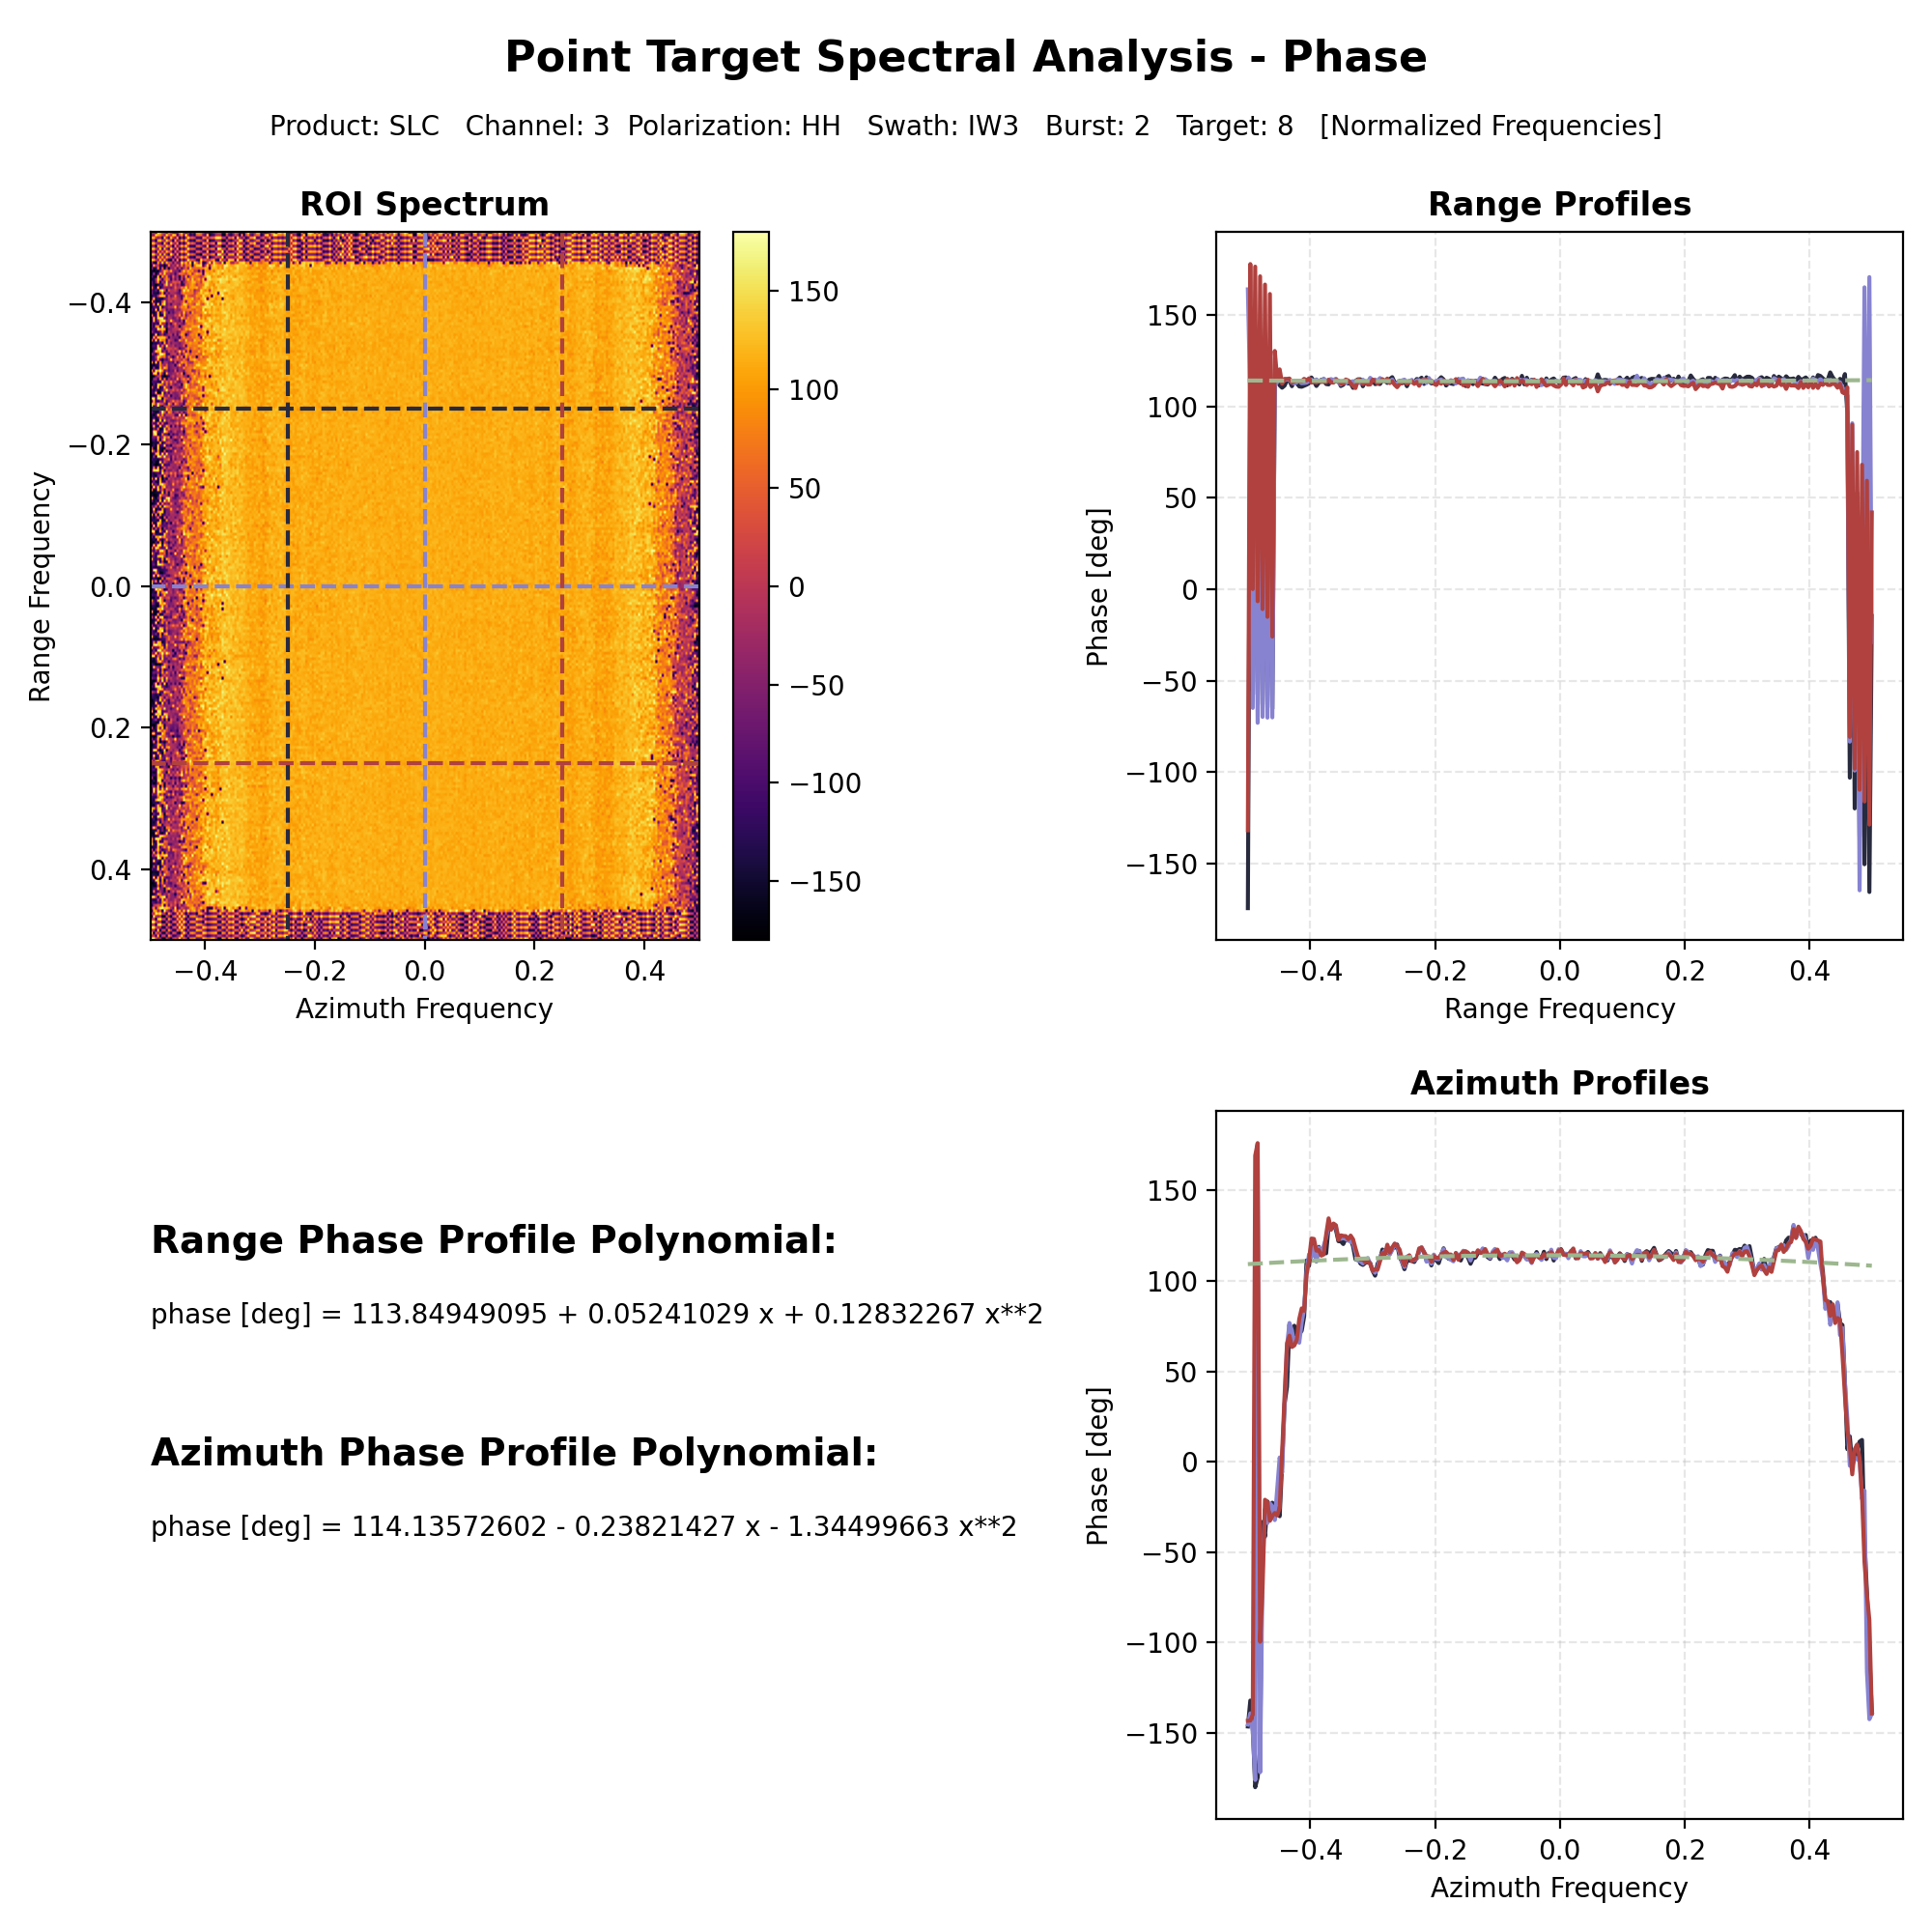
Point Target Spectral Analysis
The same graph is generated also for the Point Target Spectral Analysis but, in addition, Phase Spectral Analysis is performed to display also the phase information and profiles related to this quantity. This analysis can be performed by providing the point target coordinates in the scene like any other analysis supporting Point Targets.
Graphical output
Graphical output functionalities are available only if the package has been installed with the [graphs] optional
dependencies.
Refer to the installation documentation for further information on how to install it.
Analysis Output
Spectral analysis output consists in a .nc NetCDF4 file containing the spectral profiles computed along both
directions. Graphical output can also be generated using the graphical_output.spectral_graphs function to obtain
the plots.
Graphical output
Graphical output functionalities are available only if the package has been installed with the [graphs] optional
dependencies.
Refer to the installation documentation for further information on how to install it.